Showcase Sheffield: Sander Berge or John Lundstram

What we do with FBM contribution statistics is calculate what the probability is that a player is able to contribute to a specific team. For a player can strengthen team A, but weaken team B. We do this for four scenarios: 

  1. The best case.
  2. The most likely case.
  3. The worst case.
  4. The current form case, based on the current form of the players involved.

To calculate the probability that a player is able to contribute to a new team we look at:

  1. Difference between competitions.
  2. Difference between teams.
  3. Minutes played.
  4. FBM contribution stats.

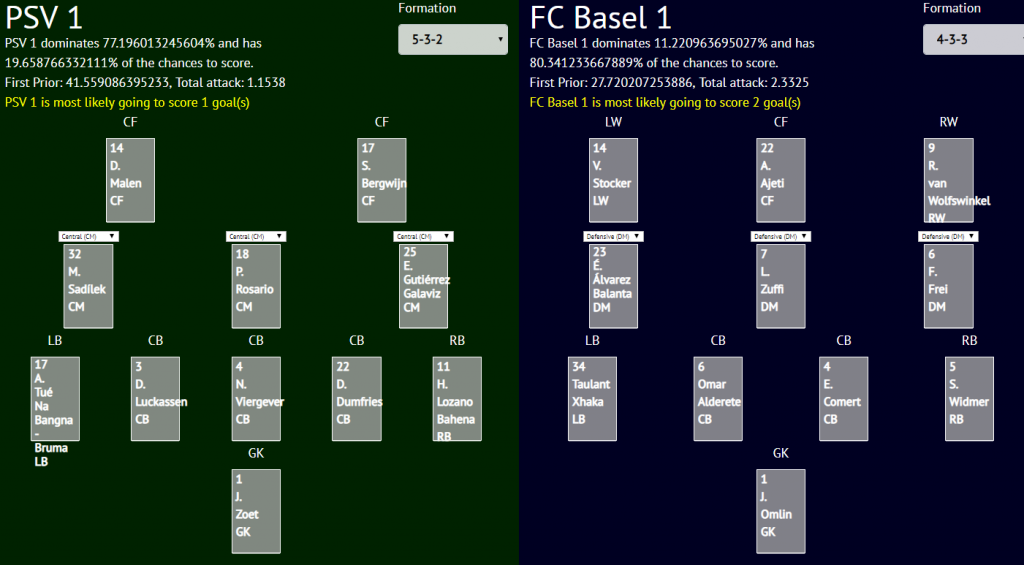
We always look at how team A would do if they replace player X with player Y. In this showcase we look at how Sheffield United would do when they replace John Lundstram with Sander Berge.

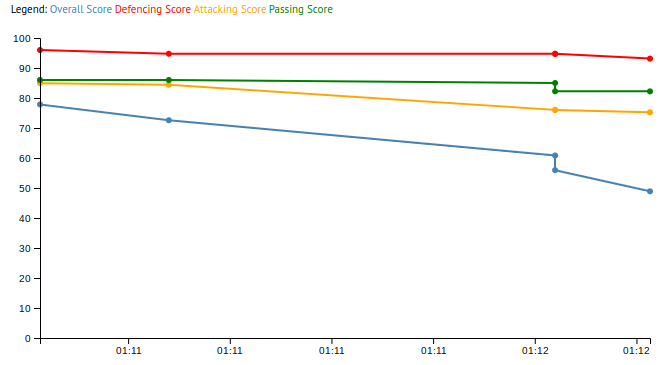
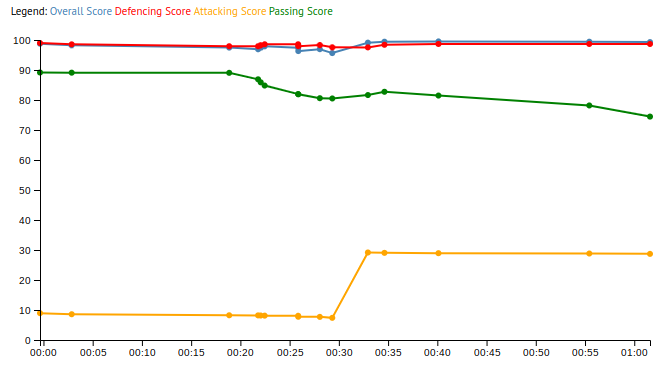
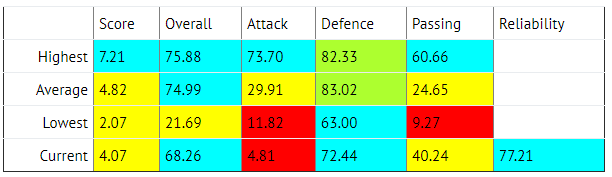
The FBM contribution stats for John Lundstram are:

John Lundstram

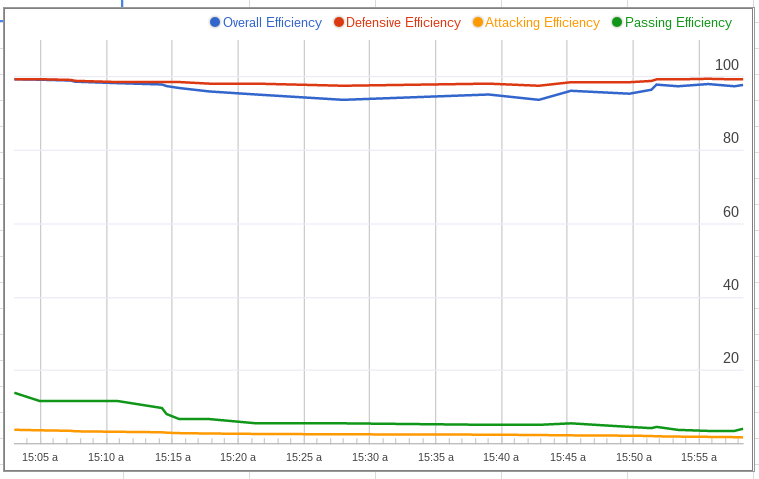
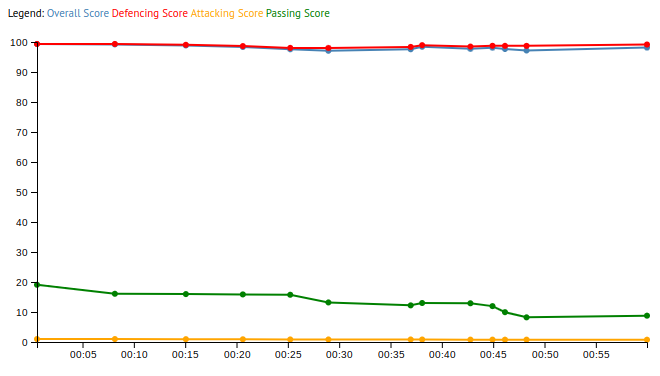
The FBM contribution stats for Sander Berge are:

Sander Berge

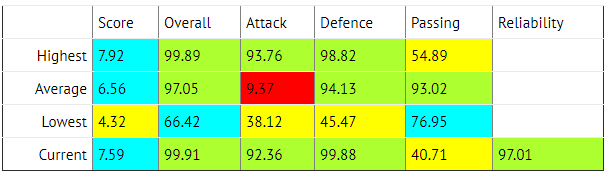
At first sight one can see that Berge scores higher in almost every category. Only the probability that Berge is able to contribute to the attack in the most likely scenario (average) is significantly lower than that of Lundstram. Yet, it is important to take into account that the probabilities for Berge are with Genk playing in the Belgium competition and Lundstram’s probabilities are with Sheffield playing in the Premier League. So we have to adapt these values.

Calculating Sander Berge’s expected contribution to Sheffield

Because probabilities don’t point to a single event happening for sure, but for multiple possible events happening with a certain probability, we always look at the four different scenarios mentioned earlier. What we do in each scenario is subtract the actual contribution of Lundstram from the FBM stats for Sheffield and then add the expected contribution of Sander Berge to Sheffield. Sander Berge’s expected contribution is based on his actual contribution to Genk deflated or inflated to compensate for the differences between the competitions, teams and minutes played.

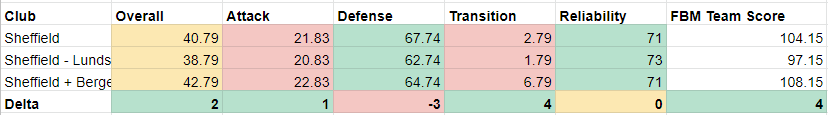
The most likely scenario

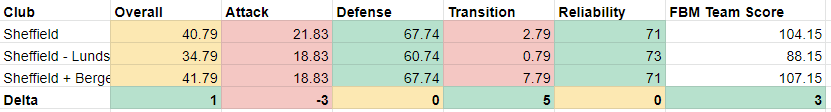
In the most likely scenario Sheffield will have a very similar overall performance. The attack of Sheffield will be a bit less strong with Berge rather than Lundstram. Defense will be the same. Transitioning & build up will be much better with Berge. The reliability of the team will remain the same. A 3 points higher FBM team score translates into one additional point in the competition for Sheffield.
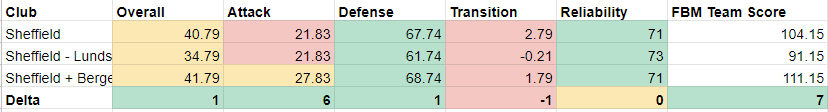
The best scenario

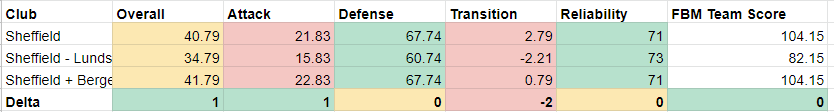
In the best scenario Sheffield will not improve much. Sheffield will trade a slightly better performance overall and in attack to an even less functioning transitioning & build up. As you can see the best scenario is worse than the most likely scenario … worse for Sheffield. But with the best scenario, we look at the best performance of both players and compare those.

The worst scenario

As you can see in the worst case, Sheffield is better off in almost every category except defense. The reason is that Sander Berge, even after compensation for a different team and a different competition, still has a higher floor in his performance than John Lundstram.

The current form scenario

The current form scenario shows that impact that Berge can make on the play of Sheffield if he is able to keep his current form at Sheffield. Our FBM contribution stats predict that he probably performs a bit less than this as per the most likely scenario. But there is a decent chance that Berge will perform like this at Sheffield, netting Sheffield 2 extra points at the end of the season when they start with Berge instead of Lundstram.

Conclusion

In all scenarios Sheffield is better off with Berge than with Lundstram except in the best case scenario. When both players play at their best, it makes little difference to Sheffield who is in the starting XI. Yet, Berge is currently performing close to his top performance, while Lundstram is currently performing below his median performance. This means that in the short term, Sheffield’s performance is most likely to improve when they start with Sander Berge.

Probability that Sander Berge contributes to Sheffield84%
Probability that Sander Berge contributes to the attack of Sheffield75%
Probability that Sander Berge contributes to the defense of Sheffield84%
Probability that Sander Berge contributes to the transitioning & build up of Sheffield22%


What happened to the players of Sudamericano U15 2017?

In 2017 we analyzed all youth players of the Sudamericano U15. Now, two years later, it is interesting to see what happened to them and how that relates to their FBM contribution statistics. We look at all youth players who played at least 3 matches. Normally, we want at least ten matches for the most probable estimation of the worth of a player. Fortunately, one of the strongest features of Bayesian statistics is that even with a few data points Bayesian statistics is still able to draw valid conclusions. That means that Bayesian statistics is ideal for estimating which youth players have the best chance of making it.

In 2017 we analyzed 193 players born in 2002 or 2003. They played between 3 and 7 matches. All youth players get the following probabilities assigned:

Player
ScoreOverallAttackDefenseTransition & buildupReliabilityNumber of games analyzed
C. de Oliveira Costa – KakàCF6.2999.1796.8375.4996.0891.775

Score is a summation of the other five probabilities. These five probabilities are:

  1. Overall is the probability that a player is able to contribute to the team in general.
  2. Attack is the probability that a player is able to contribute to the attack.
  3. Defense is the probability that a player is able to contribute to the defense.
  4. Transition & build up is the probability that a player is able to contribute to transitioning & building up.
  5. Reliability is the probability that the overall, attack, defense and transitioning & buildup probabilities remain the same in the next match. Yet, it also is an indication of how reliable the player is.

Score is a number running from 0 to 10 with players approaching 10 will be the best players in the toughest competitions. So the score of 6.29 for Kakà in the Sudamericano U15 is quite good. We use a score of 2.5 to distinguish between players who are more likely to make it in pro football. Players not able to score 2.5 points are less likely to make it.

In the Sudamericano U15 of 2017 there were 93 youth players who scored 2.5 points or more. There were 100 youth players who scored less than 2.5 points. Two years later we looked at whether they played at all in 2019 and if so how many minutes they played and how valuable the team is that they play for. Here are the results (we have also included the data for the top 30 youth players):

CriteriumTop 30 youth players according to FBM player scoreYouth players who scored 2.5 or higherYouth players who scored less than 2.5
Players still playing86.67%77.42%63%
Average value of the team the player plays for7.7 million3.6 million euro3 million euro
Average minutes played in 2019601512356

As you can see youth players who score well in FBM contribution statistics have a higher chance of still playing two years later. They play for more highly valued teams and they play more minutes.

The above results were achieved by only looking at the FBM player score. Basically, this means letting the computer decide who is the better player. When we actively evaluate these youth players ourselves, we look more closely at the FBM contribution statistics. We remove the attackers who scored 2.5 points or more, but who also have an attack probability of less than 50%. And we remove the defenders who scored 2.5 points or more, but also have an defense probability of less than 50%. 

When we evaluate players as described we only keep 78 of the 93 youth players who scored 2.5 points or more. Their results are as follows:

CriteriumTop 30 youth players according to FBM player scoreYouth players who scored 2.5 or higherYouth players who scored less than 2.5
Players still playing90%83.33%63%
Average value of the team the player plays for7.7 million4.3 million euro3 million euro
Average minutes played in 2019608542356

When you compare this second table with the first table, you can see that by not steering blindly on FBM player score, but actually looking at the underlying probabilities, allows you to select the most promising youth players even more accurately. What this means for clubs is that they can have their youth players analyzed and use FBM contribution statistics to determine which players are best to continue working with.

Predicting the winter champion in the Eredivisie

Here is a challenge: predict the number of points teams will have in the first half of the season the moment the transfermarkt closes. Here is the catch: you are only allowed to use statistics of individual players. No team statistics like wins, goals scored, goals conceded or historical team records are allowed. The reason why no historical team data is allowed is that if you are able to predict sufficiently accurately how many points each team scores, you have established a clear predictive relationship between the statistics of individual players and the number of points the team score in the league.

That is also the reason why we only look at the prediction half way through the season. Otherwise your statistic is more likely to correlate with the richness of the club, rather than the quality of the players. For rich clubs who disappoint in the first half of the season, can buy themselves better players and improve their situation. 

Football Behavior Management (FBM) predicted on September 1st 2019 for the Dutch Eredivisie using only statistics of individual players. Even though the Eredivisie had quite a different season than usual, here are the correlations between our prediction and the actual points scored:

  • Correlation = 80%
  • R² = 64%

This establishes a strong and clear relationship between how well players do in the FBM system and how many points the clubs get that employ them. If you want more points, hire players who do well in the FBM system. That doesn’t mean that if a player does bad in the FBM system, that he is automatically a bad player. The FBM system is set up with a strong bias to underestimate players, rather than overestimate them. That means that a player who does badly according to us, could very well play better next season. But more importantly, it does mean that hiring that player increases the risk of hiring the wrong players. Whereas hiring a player who does well in the FBM system lowers this risk while at the same time increase the chance of winning more points!

Prediction & evaluation

Here is our original prediction and what actually happened:

RankClubPredictionActualityDifferenceNotes
1Ajax43441We predicted the performance of Ajax quite well.
2AZ294112We predicted AZ strength, but underestimated how strong AZ was.
3PSV3534-1PSV weakness is remarkable this season and we are very happy that we predicted PSV weakness so well. 
4Willem II25338We predicted Willem II strength, but underestimated how strong Willem II was
5Feyenoord28313Feyenoord weakness is remarkable this season and we are very happy that we predicted Feyenoord weakness so well
6Vitesse26304We predicted the performance of Vitesse quite well.
7Utrecht29290We predicted the performance of Vitesse quite well.
8Heerenveen23285We predicted the performance of Heerenveen quite well.
9Heracles162610Just like last year we underestimated Heracles.
10Groningen18257We underestimated Groningen.
11Sparta20233We predicted the performance of Sparta quite well.
12Twente2419-5We overestimated the performance of FC Twente.
13Fortuna17192We predicted the performance of Fortuna Sittard quite well.
14Emmen2018-2We predicted the performance of FC Emmen quite well.
15Zwolle1816-2We predicted the performance of PEC Zwolle quite well.
16VVV2215-7We overestimated the performance of VVV.
17ADO2013-7We overestimated the performance of ADO.
18RKC1511-4We predicted the performance of RKC quite well.

Showcase: Noa Lang

Noa Lang first gotten on our radar January 22nd 2018, almost two years ago. This is his FBM contribution chart at that time of that match:

Jong Ajax vs Cambuur January 22nd 2018 (3-2)

Compared to his most recent FBM contribution chart, the only difference is that Noa Lang today has a higher transitioning & build up then two years ago:

Ajax 1 vs FC Utrecht 1 2019-11-10 12:15:00 (4-0)

Given Noa Lang’s high attacking contribution it comes as no surprise that Noa Lang scored a hattrick in the match FC Twente vs Ajax of December 1st 2019.

Showcase Sergiño Dest

Bayesian statistics, like FBM uses, needs way less data than before you can draw valid conclusions. That makes Bayesian statistics ideal for scanning youth players for talents. Sergiño Dest is a great showcase in this regard. According to Ronald Koeman, the current manager of the Dutch national team, one and a half a year ago it was not known what a great talent Dest was. Of course, this is not the case. Quite a number of professionals knew what a talent Dest was, even in the early years.

FBM for instance created this FBM contribution chart for Dest in April 2017, two and a half years ago:

Ajax U17 vs Bayern München U17 April 17th 2017 (2-0)

An FBM contribution chart that is quite the same as the chart of his most recent full game:

Ajax 1 vs Feyenoord 1 2019-10-27 16:45:00 (4-0)

With the exception of the much higher green line representing the probability that Dest is able to contribute to the transitioning & build up of Ajax. Yet, Dest’s increase in performance in transitioning and build up is very recent. A month earlier his FBM contribution FBM chart still looked like this:

Ajax 1 vs Fortuna Sittard 1 2019-09-25 20:45:00 (5-0)

It is very hard for players to do well on transitioning & build up (the green line) in our FBM system. When they do, they often become the talk of the town. So what happened with Dest is not that his talent wasn’t recognized, but that he only very recently started to play at an exceptional level. That is the reason why you use Bayesian statistics, like FBM, to keep track of talented youth players and at the same time combine that information with scouts with a proven track record for being good at predicting the progression youth players make. Then you are not surprised or disappointed when a star player chooses to play for a different national team than for the country where he grew up.

Our prediction of the Eredivisie Winter Champion 19/20

As there is an 80% correlation between FBM Team Score and the ranking in the Eredivisie and a 90% correlation between FBM Team Score and points scored in the Eredivisie, we can predict what the ranking of the clubs and the points they score. As teams that risks to be regulated can buy players that make significantly difference in the team’s performance, we can really only predict the ranking and points on January 1st 2020. In principle the same goes for any player still bought before the close of the summer transfer window, but in practice this will make very little difference to our prediction, if at all.

So without further ado, here is our definite prediction for the Eredivisie season 19/20:

RankClubAverage FBM Team ScorePoints 1/1/2020Points end of 19/20 seasonAverage points previous 5 yearsDifference
1Ajax239.54385850
2PSV197.5357079-9
3AZ160.5295767-10
4Utrecht160295761-4
5Feyenoord156.52855541
6Vitesse1442651510
7Willem II137.52549463
8Twente133244748-1
9Heerenveen1302346442
10VVV121.5224345-2
11Sparta112203940-1
12ADO111.52039381
13Emmen1112039412
14Groningen103.51836360
15Zwolle1011835314
16Fortuna961734331
17Heracles891631283
18RKC84.451530228

Explanation

This is what the columns mean in the above table:

  1. Average FBM Team Score. FBM Team Score is calculated by adding all the values of the players in the starting XI to the team score at the end of each match. This includes all the data we have of the team from the previous two seasons and the start of the new season. Older matches have less weight and recent matches weigh more.
  2. Points 1/1/2020. This is the predicted number of points that team will probably have January 1st 2020.
  3. Points end of 19/20 season. This value is only provided so we can check whether the values are in line with the average of the last five years for each position. Due to changes in the team during the winter transfer period, these values are only a prediction if no team changes anything during the winter transfer period which is of course extremely unlikely.
  4. Average points in the previous 5 seasons. This is the average points for the rank not for the club. For example, the champion in the Eredivisie had 85 points , on average over the previous 5 seasons.
  5. Difference. This is the difference between the 5 year average and our projected points for the end of the season. This shows how likely it is that we overestimate or underestimate the club. So we are likely to underestimate the number two of the Eredivisie and if that it is PSV, which is also likely, then we are underestimating PSV. And we are probably overestimating number 18, which in all likelihood won’t be Heracles, but one of the other teams just above Heracles.

Notes

  1. In our projection the teams score 6 less points than the 5 year average which is less than 1% difference of the 849 total points scored in the 5 year average.
  2. Although the model predicts the top two in the same way as most people would do, there is an anomaly in the sense that the number two of the Eredivisie would score significantly less than on average. This could be the case as the favorite teams in the Eredivisie had a rocky start of the season. Nevertheless, it is more likely that our model underestimates PSV currently.
  3. In the same light, our model seems to underestimate the upper half of the table and overestimate the bottom half of the table.
  4. The other anomaly would be the regulation of RKC with 30 points. Although it is likely that RKC will be regulated, 30 point is quite a high number of points to still be regulated. So it is likely that our model overestimates RKC.
  5. If clubs are predicted to score the same or almost the same number of points then it is obvious that the smallest change might affect whether one club is on top of the other or vice versa. For instance, we predict ADO to be on top of Emmen, but it could very well be the opposite.
  6. As this is the first season we make this prediction we have to see how clubs that are promoted from the Eerste Divisie do in this prediction. We use a deflator for historical games in the lower league, but even with the deflator promoted clubs do quite well. So we might overestimate promoted clubs. Nevertheless, Twente and Sparta did have a great start to the season.

Our prediction of the Eredivisie Winter Champion 19/20 – Preview

Please note: this is a preview of our prediction that we will make once the transfer window is closed September 2nd 2019. Yet, we don’t expect much to change between this preview and the final prediction. I will update this article once the transfer window is closed.

As there is an 80% correlation between FBM Team Score and the ranking in the Eredivisie and a 90% correlation between FBM Team Score and points scored in the Eredivisie, we can predict what the ranking of the clubs and the points they score. As teams that risks to be regulated can buy players that make significantly difference in the team’s performance, we can really only predict the ranking and points on January 1st 2020. In principle the same goes for any player still bought before the close of the summer transfer window, but in practice this will make very little difference to our prediction, if at all.

So without further ado, here is our prediction for the Eredivisie season 19/20:

RankClubAverage FBM Team ScorePoints 1/1/2020Points end of 19/20 seasonAverage points previous 5 yearsDifference
1Ajax236.5428385-2
2PSV192.5346779-12
3Utrecht173.5316167-6
4AZ162.5295761-4
5Feyenoord153.52754540
6Vitesse142255051-1
7Willem II1372448462
8Heerenveen134244748-1
9VVV1302345440
10Twente1152040452
11Emmen114.5204040-1
12Sparta111203938-1
13RKC109193841-6
14Groningen102.51836360
15ADO971734313
16Zwolle961734331
17Fortuna90.51632284
18Heracles85.51530228

Explanation

This is what the columns mean in the above table:

  1. Average FBM Team Score. FBM Team Score is calculated by adding all the values of the players in the starting XI to the team score at the end of each match. This includes all the data we have of the team from the previous two seasons and the start of the new season. Older matches have less weight and recent matches weigh more.
  2. Points 1/1/2020. This is the predicted number of points that team will probably have January 1st 2020.
  3. Points end of 19/20 season. This value is only provided so we can check whether the values are in line with the average of the last five years for each position. Due to changes in the team during the winter transfer period, these values are only a prediction if no team changes anything during the winter transfer period which is of course extremely unlikely.
  4. Average points in the previous 5 seasons. This is the average points for the rank not for the club. For example, the champion in the Eredivisie had 85 points , on average over the previous 5 seasons.
  5. Difference. This is the difference between the 5 year average and our projected points for the end of the season. This shows how likely it is that we overestimate or underestimate the club. So we are likely to underestimate the number two of the Eredivisie and if that it is PSV, which is also likely, then we are underestimating PSV. And we are probably overestimating number 18, which in all likelihood won’t be Heracles, but one of the other teams just above Heracles.

Notes

  1. In our projection the teams score 6 more points than the 5 year average which is less than 1% difference of the 849 total points scored in the 5 year average.
  2. Although the model predicts the top two in the same way as most people would do, there is an anomaly in the sense that the number two of the Eredivisie would score significantly less than on average. This could be the case as the favorite teams in the Eredivisie had a rocky start of the season. Nevertheless, it is more likely that our model underestimates PSV currently.
  3. In the same light, our model seems to underestimate the upper half of the table and overestimate the bottom half of the table.
  4. The other anomaly would be the regulation of Heracles with 30 points. This is quite a high number of points to still be regulated. Even though there is an 80% correlation between FBM Team Score and league ranking, our model put Heracles at place 12 whereas in reality they ended the league in place 6. So it could be that our model systematically underestimates Heracles. On the other hand with 30 points Heracles still gets a lot of points. It is just that other teams get more points. So it could very well be that the race against regulation could be a very tight race this year with a lot of clubs remaining under threat of regulation for a very long time. If this prediction is an indication for the coming season, it will be a very busy winter transfer window with clubs rushing to buy players to prevent regulation.
  5. If clubs are predicted to score the same or almost the same number of points then it is obvious that the smallest change might affect whether one club is on top of the other or vice versa. For instance, we predict Twente to be on top of Emmen, but it could very well be the opposite.
  6. As this is the first season we make this prediction we have to see how clubs that are promoted from the Eerste Divisie do in this prediction. We use a deflator for historical games in the lower league, but even with the deflator promoted clubs do quite well. So we might overestimate promoted clubs. Nevertheless, these two of the three promoted clubs did have a great start to the season.

How successful are transfers in the Premier League?

Everyone has an opinion on the quality of the transfers of their favorite club in the Premier League. But can we actually measure successful transfers? Here is the table of successful and unsuccessful transfers in the Premier League. The explanation follows below:

ClubSuccessful transfersUnsuccessful transfersLosses per playerLosses per yearProfit per youth player
Tottenham Hotspur88%12%5.341.0685.87
Watford84%16%3.140.6280
Everton84%16%3.440.68811.48
Leicester84%16%5.371.0742.69
Chelsea83%17%4.740.9484.28
Newcastle80%20%2.80.560.28
Bournemouth80%20%2.580.5160
Brighton80%20%1.80.360
Arsenal78%22%7.851.574.65
Manchester City77%23%8.281.6565.98
Sheffield76%24%0.650.130.97
Liverpool75%25%10.452.0910.44
Burnley74%26%1.530.3060
West Ham73%27%1.830.3663.46
Huddersfield71%29%1.170.2341.65
Average70%30%3.930.793.49
Cardiff70%30%1.10.220
Norwich60%40%3.510.7025.39
Southampton59%41%6.531.3066.26
Wolverhamperton55%45%1.40.280.51
Crystal Palace52%48%3.230.6468.25
Manchester United52%48%9.121.8242.91
Aston Villa43%57%2.510.5021.9
Fulham34%66%2.170.4343.53

The first column indicates the percentage of successful transfers. Here we mainly mean financial success. We have looked at over 800 players who have left their club in the past five years. The basic idea is that if a club received less money than what they paid for the player then it would be an unsuccessful transfer. The idea being that if he was a success at the club, he would have been worth more.

Of course, there are many exceptions. Especially if the player is playing quite some time for the club. For that reason we used a depreciation formula to decrease the amount paid for the player for each year that he actually played at the club. If a player played 5 years for the club, the transfer would be an automatic success this way/ Loan fees were also taken into account.

The second column indicates the percentage of unsuccessful transfers.

The third column indicates what, on average, an unsuccessful transfer cost the club in the past five years in millions of pounds. The fourth column is this amount divided by 5. This number is basically the amount that the club can spend each year to prevent 1 unsuccessful transfer every 5 years. Adding FBM statistics to your data analysis costs a fraction of this amount. Adding FBM statistics immediately reduces the risk of an unsuccessful transfer because we do our own data acquisition and the FBM approach is completely different than any other data provider. For that reason we are 100% complementary to existing data analysis. With FBM statistics you have another data source to confirm or disconfirm that a player will be a success at the club.

The fifth column is how much money a club has made with the transfers of their own youth players. This is an indication on whether the club ought to concentrate on scouting or youth development or both. As FBM uses Bayesian statistics FBM needs way less data before we can draw well founded conclusions. So FBM statistics is ideal for the youth development program of the club as well as youth scouting.

Some caveats in determining successful transfers

First let me stress that these numbers are an indication. One can always use a slightly different formula to divide transfers between successes and failures. Nevertheless, other approaches will basically show the same picture. 

The second point is that only players that have actually left the club are counted. If you think that there are still a lot of bad players on the roster of the club, then it is likely that the club will have worse numbers the year these players leave the club. The opposite is also true. If a club has just shed it’s dead wood, then they will probably do better in the future. But for now, this is how it looks.

Thirdly, and this connects with the second point, the numbers are relatively small. On average we considered about 30 players per club, with only a few of them unsuccessful transfers. That means that if next year a player with an unsuccessful transfer leaves the club, that it will have some impact on these percentages.

Two examples of how FBM Second Opinion would have prevented unsuccessful transfers

Paul Gladon

Paul Gladon transferred for 1.8M pound from Heracles to Wolverhampteron. Here is how FBM statistics view Paul Gladon in his last match for Heracles (see here for an explanation of how to read an FBM contribution chart).

Sparta 1 vs Heracles 1 2018-05-06 20:00:00 (2-5)

We think that it is quite likely that Wolverhampteron would have saved 1.8M euro if they had seen this chart and all our other data on Gladon.

Davy Klaassen

Although Klaassen’s FBM contribution chart is a lot better than Gladon’s chart, it still doesn’t justify the transfer from Ajax to Everton, especially if Everton wanted to use Klaassen to support their attack, rather than their defense:

The Netherlands vs Ivory Coast June 3rd 2017 (5-0)

Very telling is that even though the Netherlands won 5-0 Klaassen’s attack contribution hardly rises. This chart would and all our other data of Klaassen would probably have prevented Everton from misspending 24.3M pound.

Match preparation PSV vs FC Basel 23-7-2019

The FBM tool makes it easy to predict how upcoming matches will unfold. If we use the most recent starting XI we get the following. As soon as the actual starting XI we’ll update our FBM tool to see what the prediction is based on the actual lineup.

The most important numbers are:

  1. PSV will dominate 43% of the match and Basel 8%.
  2. PSV will have 12% of the chances and Basel 88%.
  3. The most likely outcome is 1-3, but this happens only 9% of the time.

This is the raw data. So the second step is to interpret these numbers. The first thing to notice is that while PSV has the most domination, Basel has the most chances. That means that the chance of a draw is increased. 

The second thing to notice is that although PSV has the most domination, for 49% of the time no team has any domination. This often reflects chaotic periods where no team is able to dominate or control the ball for long. If the no domination percentage is higher than the domination percentage of either team, then more often than not, the team with the highest percentage in chances will disappoint.

For that reason our FBM tool predicts the following (the text is computer generated):

Most likely winner: PSV 1
PSV 1 wins 66% of the time based on 35 matches.
FC Basel 1 wins 34% of the time based on 35 matches.
Most likely outcome: 1 – 3 (happens 9% of the time) 
This result is based on pattern Brown: Both teams are only able to dominate small parts of the game and there is the risk that the underdog becomes overconfident in which case the favorite has a bigger than average chance of winning. (Brown 5)

Most valuable players

With our FBM tool one can look of course at all players of both teams, but for this match preparation we will only look at the most valuable players of PSV and Basel. The idea is that if you are able to neutralize these players, you increase your chance to win a lot.

For PSV the most valuable player is Donyell Malen as can be seen from his most recent FBM contribution chart:

As can be seen Malen is contributing a lot to PSV’s attack (yellow), defense (red) and overall play (blue). Transitioning (green) improved, but against an easier opponent than Basel, so we don’t expect Malen to contribute in that regard that much in this match.

For Basel the most valuable player is Jahlil Okafor as can be seen from his most recent FBM contribution chart:

Okafor has a very similar FBM contribution chart as Malen. The differences are a slightly lesser defensive contribution (red), but a considerable higher transitioning contribution (green).

Weakest defender

While the most valuable player is the number one target to neutralize, the weakest defender is the best area of defense to target for the attack.

For PSV the weakest defender is Luckassen. So attacking through the center is most likely to result in a goal for Basel.

For Basel the weakest defender is Widmer. So for PSV attacking Basel’s right flank would give the best chance to score.

We’ll update this article as soon as the actual starting XI are known.

Update with actual lineup:

PSV comes up with a very surprising starting XI and formation. A 3-5-2 formation according to the UEFA (displayed in our tool as a 5-3-2 formation as that is what happens most of the time when the wings are really wing backs, but in this case the wings are really wingers):

This new formation is good and bad news for PSV both at the same time. The good news is that both domination and chances have increased. Also due that Basel is not playing in their strongest formation according to our data as Basel is not starting with Okafor.

The bad news is that with this formation Basel is probably going to risk less and defend more. It has become unlikely that Basel becomes overconfident. That this means for PSV is that PSV now actually lesss chance to win and the most likely outcome is a draw. There is also less risk for PSV to lose the match. So in that sense, even though the new formation is quite innovative, it is still playing on safe. The same goes for Basel, but then by using a conservative approach to the match.

So the new numbers look like this:

  1. PSV will dominate 77% of the match and Basel 11%.
  2. PSV will have 20% of the chances and Basel 80%.
  3. The most likely outcome is 1-2, but this happens only 9% of the time.

And the computer generated description of the match reads as follows:

Most likely outcome: draw
PSV 1 wins 42% of the time based on 155 matches.
FC Basel 1 wins 28% of the time based on 155 matches.
Most likely outcome: 1 – 2 (happens 9% of the time) 
This result is based on pattern White: The favorite dominates most of the game, but the underdog has most of the chances (mostly through countering), so more than average it becomes a draw. (White 4)

Post match update

Although PSV won with a 3-2 result, the match unfolded pretty much as we predicted. Orginially we thought that PSV would win 66% of these kind of games. With the actual lineup we brought this percentage down to 42%. A big difference with the 67% win chance that the sports betting industry thought it would be. Given that Basel was leading 1-2 5 minutes before the end of the match, we think that 67% – although ultimately correct – was estimating PSV too strongly.

Our final estimation of a draw also turned out to be wrong, but very reasonable. A 1-2 result would be too much for Basel, but PSV was also very lucky in the dying moments of the match. So a draw was the most reasonable estimate before the match.

The weakest defenders were also correctly predicted with both defenders (Luckassen and Widmer) failing to prevent the opening goals. Looking at Widmer’s FBM contribution chart one can see that his performance in the match was the same as what we expected before the match:

Widmer in PSV vs FC Basel 23-7-2019

Basel did have a lot less chances than we predicted, although we correctly predicted the number of goals Basel scored. PSV had a bit more chancees than expected, but scored a lot more than we predicted. So all players will be updated with their performance in this match and the match that the teams play the coming week. Then we will create a new prediction for the return.

Why Răzvan Marin is a decent replacement for Frenkie de Jong

One of the questions that many people have when it comes to the upcoming 19/20 Eredivisie season is whether Răzvan Marin is a good replacement for Frenkie de Jong. In this article I want to show you how to answer that question using FBM statistics. Our approach consists of three steps:

  1. Subtract De Jong from Ajax.
  2. Add Marin to Ajax.
  3. Compare Ajax with De Jong to Ajax with Marin.

With FBM statistics you can literally subtract players from a team as we have an FBM team score which is the same kind of data as an FBM players score. Ajax with De Jong has the following FBM team score:

ClubOverallAttackDefenseTransitionSurpriseFBM team score
Ajax7338594815203

These numbers are the average FBM players scores of the starting XI of Ajax in the 18/19 season. Besides the absolute numbers, which indicate the strength of the team for all football clubs, one also has to look at the ratio of these numbers as that gives more insight in how well balanced the team is. For Ajax with Frenkie de Jong the balance of the team looks as follows:

(The less defense the better, the more transition and attack the better.)

The score for Frenkie de Jong looks almost the same:

PlayerOverallAttackDefenseTransitionSurprise
Frenkie de Jong94197916

Yet, we have to divide these numbers by 11 and normalize for the percentage of the minutes that De Jong actually played. Then we can subtract those numbers of Ajax’ FBM team score to see how Ajax looks without De Jong. These numbers are:

ClubOverallAttackDefenseTransitionSurpriseFBM team score
Ajax with de Jong7338594815203
Ajax minus de Jong (with 10 players)6638524115182

You can immediately see that De Jong had very little impact on Ajax’ attack, but as only one player in a team of eleven players (9.09%), he had a major impact on defending (11.86%) and transitioning (14.58%).

Next we take Marin’s numbers at Standard Liege:

PlayerOverallAttackDefenseTransitionSurprise
Marin682045113

Those numbers look a lot less than Frenkie de Jong’s numbers. But we also have to compensate for the difference in leagues (Eredivisie vs Jupiler Pro League) and quality of the team and the team members (Ajax vs Standard Liege). When we use our Bayesian model to compensate for these matters, Marin’s most probable numbers for his play at Ajax are:

PlayerOverallAttackDefenseTransitionSurprise
Marin84396836

These numbers still look less than the numbers of Frenkie de Jong. But let’s see what happens when we add these numbers to Ajax. Again, in our model we normalize for played minutes and differences between the team. We then get:

ClubOverallAttackDefenseTransitionSurpriseFBM team score
Ajax with de Jong7338594815203
Ajax with Marin7341574115197

If we only look at the FBM team score, you can see that the scouts of Ajax did a great job as with Marin, Ajax is only 3% weaker (197 vs 203). If we look at the more detailed numbers, we can see that this is mainly due to the fact that Marin more strongly supports Ajax’ attack (41 vs 38). At the same time, transitioning will be less effective with Marin instead of De Jong (41 vs 48). To most observers that would be obvious. Nevertheless, we are always happy when our model comes up with obviousness. It is an interesting trade-off. Yet, given how hard it is to find players that support transitioning, it is also very understandable that Ajax has made this trade-off.

The most interesting part though is the balance of the team:

The slight increase in defense reflects that Ajax has become a little bit weaker with Marin instead of De Jong. Nevertheless, this is compensated by having transitioning and attacking more in balance. That’s why we think that Marin is a decent replacement for Frenkie de Jong.

How probable is it that Marin is able to contribute?

As we always stress that football data is meaningless, unless you can answer the question: “What is the probability that a player is able to contribute?”, let me make this more explicit in the case of Marin. As Marin’s numbers above are his probabilities. 

PlayerOverallAttackDefenseTransitionSurprise
Marin84396836

So let’s answer the following questions:

  1. What is the probability that Marin is able to contribute to Ajax overall? Answer: 84%
  2. What is the probability that Marin is able to contribute to Ajax’s attacking? Answer: 39%
  3. What is the probability that Marin is able to contribute to Ajax’ defending? Answer: 68%
  4. What is the probability that Marin is able to contribute to Ajax transitioning? Answer: 3%

These numbers have a plus or minus 6% points room to deviate (the surprisal rate).